租房有深坑?手把手教你如何用R速读评论+科学选房
作者:媒体转发 时间:2018-09-02 16:28

大数据文摘出品
编译:Hope、臻臻、CoolBoy
最近,租房这事儿成了北漂族的一大bug,要想租到称心如意的房子,不仅要眼明手快,还得看清各类“前辈”的评价避开大坑。一位程序员在出行选酒店的时候就借用了程序工具:先用python爬下了海外点评网站TripAdvisor的数千评论,并且用R进行了文本分析和情感分析,科学选房,高效便捷,极具参考价值。
以下,这份超详实的教程拿好不谢。
TripAdvisor提供的信息对于旅行者的出行决策非常重要。但是,要去了解TripAdvisor的泡沫评分和数千个评论文本之间的细微差别是极具挑战性的。
为了更加全面地了解酒店旅客的评论是否会对之后酒店的服务产生影响,我爬取了TripAdvisor中一个名为Hilton Hawaiian Village酒店的所有英文评论。这里我不会对爬虫的细节进行展开。
Python源码:
https://github.com/susanli2016/NLP-with-Python/blob/master/Web%20scraping%20Hilton%20Hawaiian%20Village%20TripAdvisor%20Reviews.py
加载扩展包
library(dplyr)
library(readr)
library(lubridate)
library(ggplot2)
library(tidytext)
library(tidyverse)
library(stringr)
library(tidyr)
library(scales)
library(broom)
library(purrr)
library(widyr)
library(igraph)
library(ggraph)
library(SnowballC)
library(wordcloud)
library(reshape2)
theme_set(theme_minimal())
数据集
df <- read_csv("Hilton_Hawaiian_Village_Waikiki_Beach_Resort-Honolulu_Oahu_Hawaii__en.csv")
df <- df[complete.cases(df), ]
df$review_date <- as.Date(df$review_date, format = "%d-%B-%y")
dim(df); min(df$review_date); max(df$review_date)
Figure 2
我们在TripAdvisor上一共获得了13,701条关于Hilton Hawaiian Village酒店的英文评论,这些评论的时间范围是从2002–03–21 到2018–08–02。
df %>%
count(Week = round_date(review_date, "week")) %>%
ggplot(aes(Week, n)) +
geom_line() +
ggtitle('The Number of Reviews Per Week')
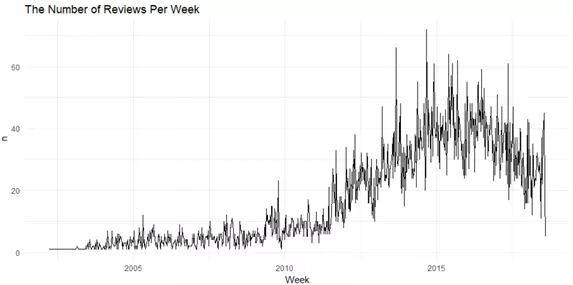
Figure 2
在2014年末,周评论数量达到最高峰。那一个星期里酒店被评论了70次。
对评论文本进行文本挖掘
df <- tibble::rowid_to_column(df, "ID")
df <- df %>%
mutate(review_date = as.POSIXct(review_date, origin = "1970-01-01"),month = round_date(review_date, "month"))
review_words <- df %>%
distinct(review_body, .keep_all = TRUE) %>%
unnest_tokens(word, review_body, drop = FALSE) %>%
distinct(ID, word, .keep_all = TRUE) %>%
anti_join(stop_words, by = "word") %>%
filter(str_detect(word, "[^\\d]")) %>%
group_by(word) %>%
mutate(word_total = n()) %>%
ungroup()
word_counts <- review_words %>%
count(word, sort = TRUE)
word_counts %>%
head(25) %>%
mutate(word = reorder(word, n)) %>%
ggplot(aes(word, n)) +
geom_col(fill = "lightblue") +
scale_y_continuous(labels = comma_format()) +
coord_flip() +


;)
;)
;)
;)